General instructions: Answer all questions. Marks are shown in brackets [ ].
Objective
1.
Using a graph paper, draw a histogram for the given distribution showing the number of runs scored by 50 batsmen in IPL and estimate the mode of the data.
Runs Scored
Number of batsman
200-300
4
300-400
18
400-500
9
500-600
7
600-700
6
700-800
4
800-900
2
What is the mode of the given distribution?
A.300 runs
B.350 runs
C.400 runs
D.450 runs
[1]
2.
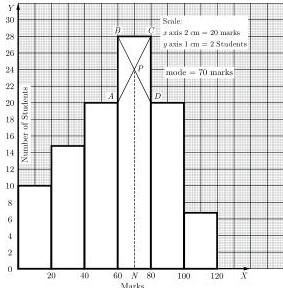
(i) Use graph paper for this question. (Take $2\mathrm{cm} = 10$ Marks along one axis and $2\mathrm{cm} = 10$ students along another axis). A histogram is drawn for the marks obtained by 164 students in a particular class. From the histogram, what is the mode of the distribution?
A.58.25
B.64.12
C.70.50
D.76.75
[1]
3.
Marks obtained by 100 students in an examination are given below:
Marks
0-20
20-40
40-60
60-80
80-100
100-120
Number of Students
10
15
20
28
20
7
Draw a histogram for the given data using graph paper and determine the mode.
A.65 marks
B.70 marks
C.75 marks
D.80 marks
[1]
4.
Following frequency distribution shows the expenditure on milk of 35 households in a locality. Draw a histogram for the data using graph paper and locate the mode.
Daily milk expenditure (Rs.)
Number of households
0-20
5
20-40
6
40-60
9
60-80
6
80-100
4
100-120
5
A.₹40
B.₹50
C.₹60
D.₹70
[1]
5.
Draw a histogram for the following data showing the ages of 200 patients getting medical treatment in a hospital and locate the mode from the graph.
Age (In years)
No. of Patients
10-20
40
20-30
22
30-40
35
40-50
50
50-60
23
60-70
30
What is the mode of the given distribution?
A.40 years
B.43.5 years
C.45 years
D.50 years
[1]
6.
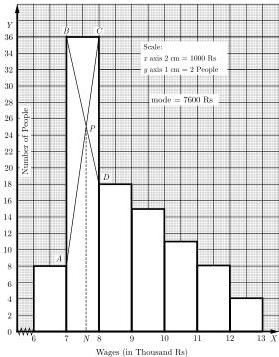
Monthly daily wages of 110 workers, obtained in a survey, are tabulated below:
Wages (in ₹)
Number of people
6000-7000
8
7000-8000
36
8000-9000
18
9000-10000
15
10000-11000
11
11000-12000
8
12000-13000
4
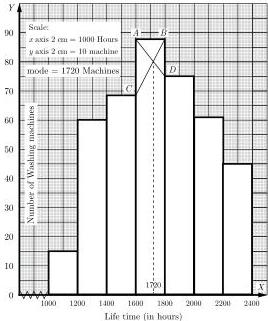
Use graph paper to draw a histogram and hence determine the mode of the given distribution.
A.₹7400
B.₹7600
C.₹7800
D.₹8000
[1]
7.
Draw a histogram from the following frequency distribution and determine the mode from the graph.
Class
20-25
25-30
30-35
35-40
40-45
45-50
Frequency
3
10
36
28
15
12
What is the mode of the given distribution?
A.₹35
B.₹40
C.₹43
D.₹45
[1]
8.
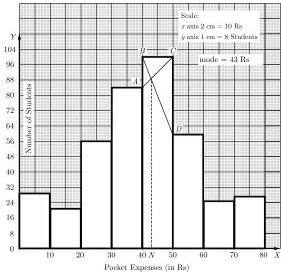
Use a graph paper to draw a histogram representing the daily pocket expenses of 100 students and estimate the mode from the graph.
Pocket expenses (in Rs.)
Number of students
0-10
7
10-20
5
20-30
14
30-40
21
40-50
25
50-60
15
60-70
6
70-80
7
What is the mode of the given distribution?
A.₹30
B.₹36
C.₹40
D.₹45
[1]
9.
Draw a histogram for the following frequency distribution showing the distance thrown by 70 students in a Javelin throw competition and locate the mode from the graph.
Distance (in m)
No. of students
0-10
6
10-20
7
20-30
13
30-40
20
40-50
14
50-60
7
60-70
3
What is the mode of the given distribution?
A.30 meters
B.34 meters
C.38 meters
D.40 meters
[1]
10.
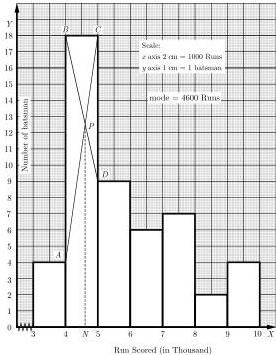
Using a graph paper, draw a histogram for the given distribution showing the number of runs scored by 50 batsmen and estimate the mode of the data.
Runs Scored
Number of batsman
3000-4000
4
4000-5000
18
5000-6000
9
6000-7000
6
7000-8000
7
8000-9000
2
9000-10000
4
What is the mode of the given distribution?
A.300 runs
B.360 runs
C.400 runs
D.500 runs
[1]
11.
The weekly observation on cost of living index in a certain city for a particular year is given in the table below. Using a histogram and the method of intersecting lines AC and BD in the highest rectangle, determine the mode of the data.
Cost of Living Index
Number of Weeks
140-150
5
150-160
10
160-170
20
170-180
9
180-190
6
190-200
2
A.160
B.165
C.170
D.155
[1]
12.
The frequency distribution of the heights of 70 students is provided below. Using a histogram and the method of intersecting lines AC and BD in the highest rectangle, determine the mode of the data.
Height (in cm)
Number of students
150 - 155
12
155 - 160
14
160 - 165
16
165 - 170
12
170 - 175
10
175 - 180
8
A.160 cm
B.162 cm
C.165 cm
D.158 cm
[1]
13.
A Mathematics aptitude test of 50 students is given below. Using the histogram drawn from this data, locate the mode by identifying the abscissa where the two straight lines AC and BD (drawn in the highest rectangle) intersect and meet the x-axis.
Marks
50-60
60-70
70-80
80-90
90-100
Number of students
4
8
14
19
5
A.42 marks
B.46 marks
C.50 marks
D.85 marks
[1]
14.
Using the data given below, a cumulative frequency table is constructed and an ogive is drawn.
Marks
Number of students
0-10
3
10-20
8
20-30
12
30-40
14
40-50
10
50-60
6
60-70
5
70-80
2
From the ogive, what is the median marks obtained by the students?
A.25
B.30
C.35
D.40
[1]
15.
For the given frequency distribution, draw a histogram and use the method of intersecting lines AC and BD in the highest rectangle to calculate the mode.
Class
0-5
5-10
10-15
15-20
20-25
25-30
Frequency
2
7
18
10
8
5
A.10
B.13
C.15
D.12
[1]
16.
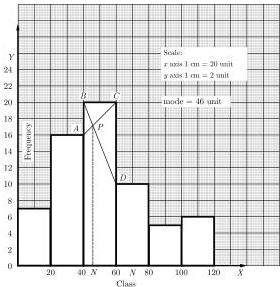
Use graph paper to draw a histogram for the following frequency distribution and hence estimate the mode.
Class
0-20
20-40
40-60
60-80
80-100
100-120
Frequency
7
16
20
10
5
6
A.40
B.46
C.50
D.60
[1]
17.
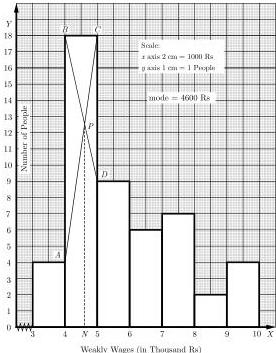
Draw a histogram for the given data on a graph paper and estimate the mode from the graph.
Weekly wages (in ₹)
Number of people
3000-4000
4
4000-5000
18
5000-6000
9
6000-7000
6
7000-8000
7
8000-9000
2
9000-10000
4
What is the mode of the given distribution?
A.₹4000
B.₹4600
C.₹5000
D.₹5500
[1]
18.
The following distribution gives the daily wages of 60 workers of a factory.
Daily income in ₹
Number of workers (f)
200–300
6
300–400
10
400–500
14
500–600
16
600–700
10
700–800
4
Use graph paper to draw a histogram and hence determine the mode of the given distribution.
A.₹475
B.₹500
C.₹525
D.₹550
[1]
19.
A stopwatch was used to find the time that it took a group of students to run 100m. Using the histogram drawn from this data, locate the mode by identifying the abscissa where the two straight lines AC and BD (drawn in the highest rectangle) intersect and meet the x-axis.
Time (in sec)
No. of students
0-20
8
20-40
10
40-60
13
60-80
6
80-100
3
A.40 seconds
B.50 seconds
C.82.6 seconds
D.60 seconds
[1]
20.
A Mathematics aptitude test of 100 students is given below. Using the histogram drawn from this data, locate the mode by identifying the abscissa where the two straight lines AC and BD (drawn in the highest rectangle) intersect and meet the x-axis.
Marks
30-40
40-50
50-60
60-70
70-80
Number of students
13
11
28
38
10
A.58 marks
B.62 marks
C.65 marks
D.70 marks
[1]
— End of paper —
New to AI Exam Master?
Chapter-wise practice, mock tests, AI tutor & the full ICSE syllabus — see everything on the main site.