ICSE Class 10 Histogram and Ogive — Mock Test (2027)
Free online mock test for Histogram and Ogive (ICSE Class 10 Mathematics) — 20 competency-based questions based on the latest CISCE 2027 syllabus, with instant marking. Try the samples below, then take the full test free.
What to expect: This mock test covers key concepts from the Histogram and Ogive chapter — including application-based and competency-focused questions aligned with how ICSE actually sets the paper.
Tip: Attempt without notes first to identify gaps, then review explanations for any wrong answers. Retake after a few days for best retention.
Sample questions
-
1.Monthly daily wages of 110 workers, obtained in a survey, are tabulated below:
Use graph paper to draw a histogram and hence determine the mode of the given distribution.Wages (in ₹) Number of people 6000-7000 8 7000-8000 36 8000-9000 18 9000-10000 15 10000-11000 11 11000-12000 8 12000-13000 4 - A.₹7400
- B.₹7600
- C.₹7800
- D.₹8000
-
2.Following frequency distribution shows the Air Quality Index of different localities of Delhi on 27th January 2024. Using the histogram drawn from this data, locate the mode by identifying the abscissa where the two straight lines AC and BD (drawn in the highest rectangle) intersect and meet the x-axis.
AIQ Number of Weeks 270-280 4 280-290 10 290-300 14 300-310 20 310-320 24 320-330 8 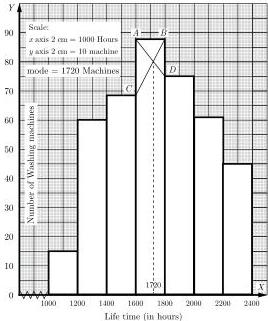
- A.305 AIQ
- B.310 AIQ
- C.312 AIQ
- D.320 AIQ
-
3.Marks obtained by 100 students in an examination are given below:
Draw a histogram for the given data using graph paper and determine the mode.Marks 0-20 20-40 40-60 60-80 80-100 100-120 Number of Students 10 15 20 28 20 7 - A.65 marks
- B.70 marks
- C.75 marks
- D.80 marks
-
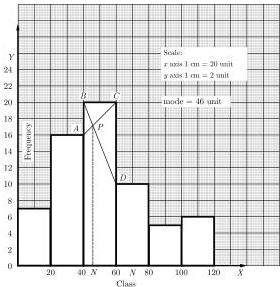
4.A student noted the number of cars passing through a spot on a road for 100 periods each of 3 minutes. Using the histogram drawn from this data, locate the mode by identifying the abscissa where the two straight lines AC and BD (drawn in the highest rectangle) intersect and meet the x-axis.
Number of cars Number of Periods 0-10 7 10-20 14 20-30 13 30-40 12 40-50 20 50-60 11 60-70 15 70-80 8 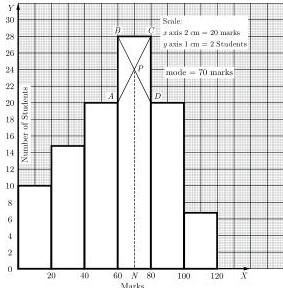
- A.45 cars
- B.50 cars
- C.54 cars
- D.60 cars
-
5.Draw a histogram for the given data on a graph paper and estimate the mode from the graph.
What is the mode of the given distribution?Weekly wages (in ₹) Number of people 3000-4000 4 4000-5000 18 5000-6000 9 6000-7000 6 7000-8000 7 8000-9000 2 9000-10000 4 - A.₹4000
- B.₹4600
- C.₹5000
- D.₹5500
Ready? Take the full 20-question test free — instant marking, no sign-up needed.
▶ Start free mock test